
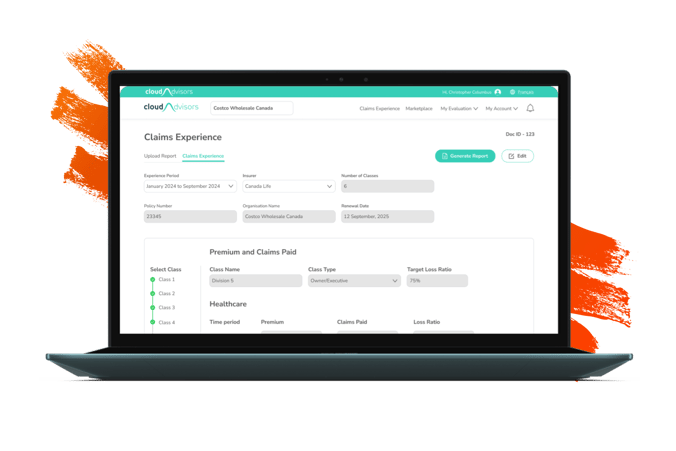
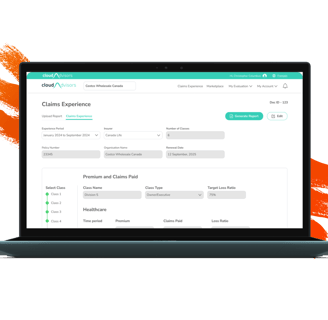
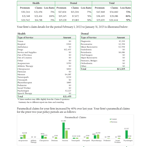
Claims Experience
Every insurance advisor shares a "Claims Experience Report" with their clients that outlines the "Premiums Paid and Claims Settled." Claims Experience is initially prepared by the insurance provider and then shared to the advisor.
The primary purpose of this document is to keep clients informed about the premiums they have paid and the claims that have been settled, as this information directly impacts the premium amounts they may be required to pay in the following year.
The challenge
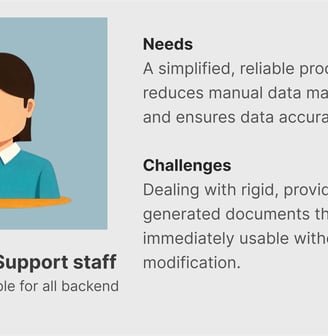
Insurance advisors needs to work with a claims documents, created by the insurance provider, which requires them to manually re-enter, reformat, and verify data multiple times a year.
This manual process is costly, time-consuming, prone to error, and inefficient. Hence it is imperative that a product is introduced to automate this process.
My role
I was responsible for this project from end to end. I managed the project from the kickoff meeting to the launch the product. I was supported by 3 developers and product management team.
Phase 1
Discover
Secondary Research
Research was conducted by reviewing available documents on claims experience and analyzing actual claims records. Additionally, a competitive analysis was carried out.
Competitive Analysis
Approach : Competitive analysis was performed by gathering publicly available information and using indirect methods since access to competitor platforms or internal data is not possible. I also reviewed competitor websites, marketing pages and social media.
Objective: My objective isn’t simply to replicate what competitors are doing, but to understand the expectations users develop from using similar tools and strategically position our product to surpass those expectations.
Claims Summary Document
Claims summary documents were gathered from various insurance companies to analyze patterns and identify commonalities across providers. This approach helped uncover potential scenarios and informed strategic planning.
Primary Research
I conducted interviews with internal stakeholders as well as with customers, including advisors and their support staff. Additionally, surveys were carried out to gather broader insights.
User Interviews - Internal Stakeholder
Internal stakeholders often engage in frequent conversations with customers and have access to valuable insights and detailed information about their needs and requirements. This helps me get more understanding before talking with customers.
User Interviews - Customers
The primary goal is to uncover their pain points and gain a clear understanding of the solution they truly need. I also use this opportunity to ask any unresolved questions that internal stakeholders may not have been able to answer.
Surveys
Surveys were distributed to customers who could not be reached for a direct meeting. This ensured we still gathered valuable input from a broader audience, helping us capture diverse perspectives and needs.
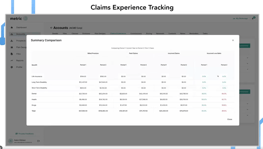

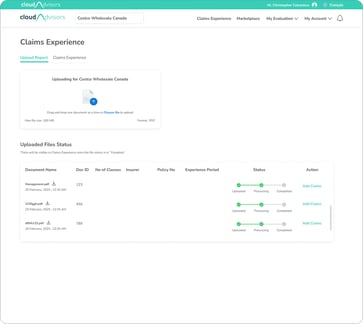
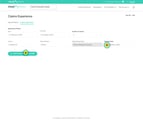
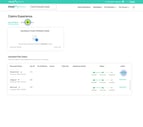
Screenshots of some claims document that were referred during the process
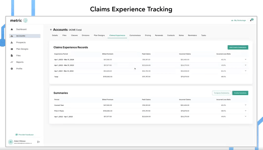
Screenshots of claims experience created by a competitor, from their website.
Explore
Phase 2
Impact
The repetitive nature of the task not only drains valuable time but also leads to data inconsistencies and increased stress as advisors struggle to keep up with updates and corrections. There is also a burden of ensuring that all changes comply with regulatory standards.
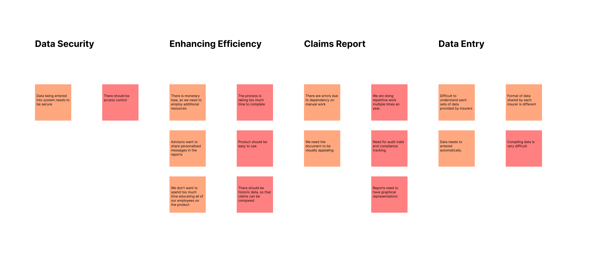
Pain Points
1. Limited Flexibility: Advisors feel constrained by the rigid, pre-formatted document provided by insurers, leaving little room for customization according to their specific needs.
2. Cumbersome Data Handling: The manual re-entry of data and constant need to verify against multiple sources leads to significant errors and inefficiencies.
3. Workflow Fragmentation: The process often involves toggling between various systems or manual steps, exacerbating the complexity and increasing the risk of outdated information or version control issues.
4. Audit & Compliance Concerns: Manual modifications make it challenging to maintain robust audit trails, which are essential for compliance in insurance and regulatory standards.
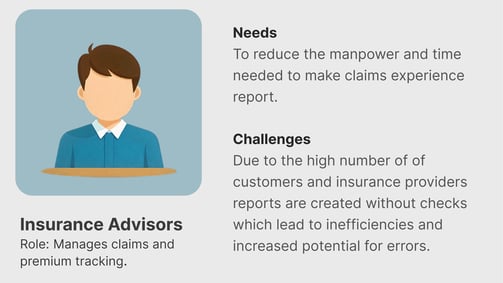
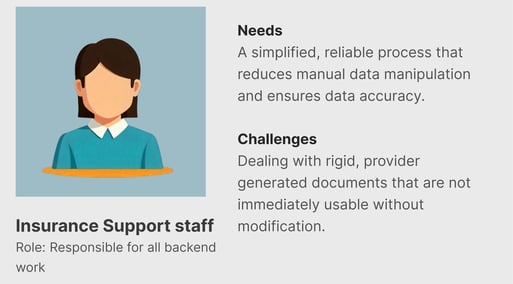
User Persona
Opportunity Areas
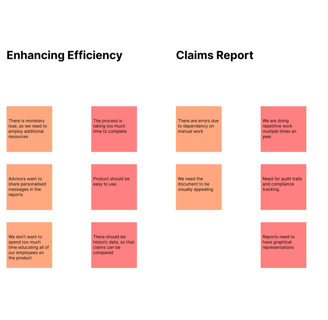
1. Time Efficiency: Reduction in time spent on manual data entry and document finalization.
2. Accuracy Improvements: Decrease in the error rate of documents generated after the adoption of automation features.
3. User Satisfaction: Higher satisfaction scores based on advisor feedback regarding the new system’s usability and reliability.
4. Audit Compliance: Improved capability to track changes and maintain audit trails without additional manual effort.
Success Metrics & KPI
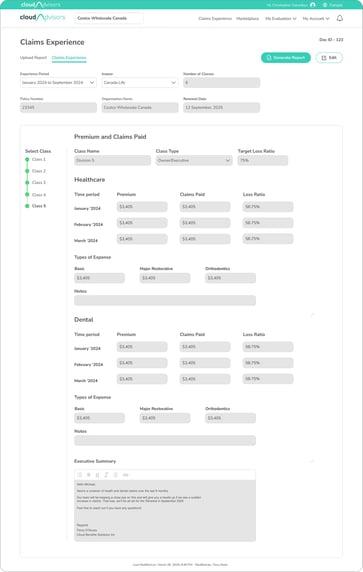
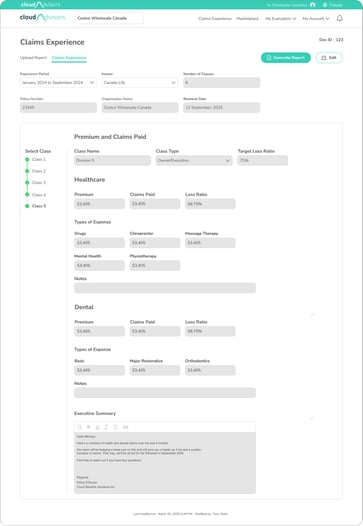
1. Automation of Data Entry: Develop features that automatically extract data from the insurer’s document, populate customized fields, and reduce the manual workload significantly.
2. Dynamic Document Customization: Build a tool that can intelligently parse the standard document and allow advisors to customize the output according to their specific reporting requirements.
3. Version Control & Audit Trails: Implement a system that tracks every change and maintains clear, secure logs that meet regulatory compliance, ensuring trust and transparency.
Affinity Mapping
Affinity Mapping was performed to link the inputs from discover phase and find the insight. Please click the
Information Architecture (IA)
IA was created and shared with developers, product management team and stakeholders. Please click the link to view.


Wireframes
Design & Test
Phase 3
Begin with low-fidelity sketches and paper prototypes to explore multiple interface layout options.
Brainstorming & Sketching
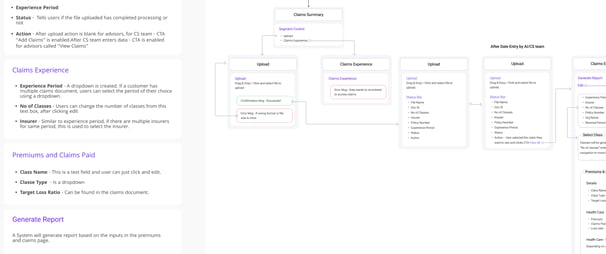
Created structured wireframes that outline the layout, navigation, and key interactive elements with focus on illustrating the flow of data from the document to the final, auto-populated/entered fields.
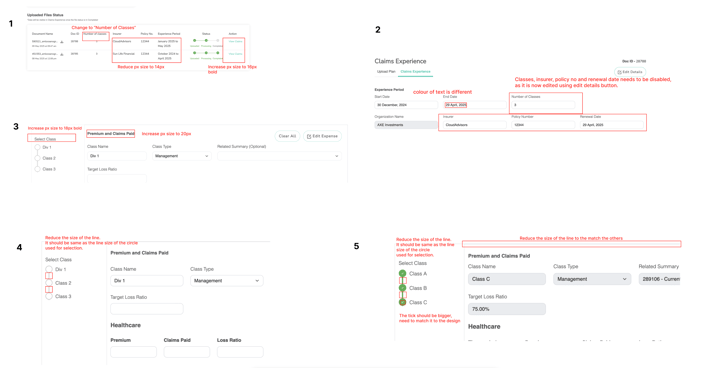
Usability Testing
Number of Participants - 5
Visual Design
Conducted usability sessions using the mockups and prototypes to validate design decisions.
Observations
1. Data needs to be categorised by "Class" which was missing in the initial design.
2. Class also needed to be organised by "Class Type".
3. "Class Names" also needed to be implemented as it is unique to each client.
Wireframes
Number of Participants - 5
Observations
No other observation.
The developed website then underwent Quality Assurance Test to ensure that the designed version and the developed versions were matching.
Quality Assurance Test
Provide a comprehensive handoff document with all the deliverables like research findings and designs.
Include detailed descriptions for each screen or component, highlighting how dynamic data is managed and validated.
Deliver & Collaborate
Phase 4
Prepare Handoff Documentation
Collaboration & Clarification Sessions
Conduct handoff meetings or walkthrough sessions with the development team to present the design prototypes.
Create an open channel for ongoing communication using collaboration tools, enabling developers to ask questions or request clarifications during implementation.
5 rounds of testing was conducted and all findings were cleared before production. Here is a link to the QAT findings.
SucessMetrics & KPI
Once the product has been deployed into a live environment, the work shifts to confirming that it meets user needs in real-world scenarios. This phase combines additional
1. usability testing
2. systematic feedback gathering and
3. thorough monitoring of analytical data to validate functionality, performance, and overall usability.
The goal is to continuously iterate and refine the product based on concrete insights.
Measure & Iterate
Phase 5
Customer Feedback Collection
Quality and Usability Testing :Conduct tests where users perform typical tasks to identify any edge cases or unforeseen barriers that only occur under production conditions.
Session Recordings & Heatmaps: Utilize analytics tools to see where users hesitate or divert from expected workflows, providing concrete examples of usability bottlenecks.
Our post-launch analysis confirms that all key performance indicators have been met. The product has demonstrated substantial improvements in efficiency, accuracy, and user engagement, validating our initial goals.
Live Environment Testing
Direct User Inputs : Customer support talks directly to users to give inputs and collect feedbacks on the product and collect and document stories that highlight specific ways the product has improved or hindered their workflow.
Analytics: Track usage patterns such as session duration, frequency of use, Monitor how efficiently users are completing tasks, Analyze key conversion steps to detect where users drop off, which may indicate confusing workflows or design pitfalls.
Iteration & Continuous Improvement
Data Synthesis and Identification of Priorities -
1. Backlog Creation : Combine all usability findings, feedback, and analytical data to create a prioritized list of issues and enhancement opportunities.
2. Fix a Roadmap: Adjust the product roadmap by adding incremental improvements or new features based on user demand and performance metrics.
Collaborate & Iterate - Work closely with the development team to plan and execute iterations that address critical usability or performance issues.